Coding and Tracing Workflow Remix (feat. Dark)
Startups and projects blurring the boundaries between development and monitoring
This is Monitoring Monitoring, a quasi-monthly newsletter about early-stage startups in the observability space. Subscribe here.
The issue this month is about startups and projects that are blurring the boundaries between development and monitoring—from debugging Kubernetes clusters (Squash and Telepresence), instrumentation controlled by cloud-based code breakpoints (Rookout), or a new programming language and infrastructure (Dark).
Software engineers have different toolchains and workflows for coding, testing and monitoring. These companies and projects are bringing these workflows closer together (or reinventing them) to make building and operating modern backend services easier.
Kubernetes Debugging with Clever Proxies
The Kubernetes meme ecosystem is exploding, but classics involve developers reacting to getting started with Kubernetes. One particular pain point for devs is traditional debugging—setting a breakpoint and tracing execution through lines of code in a favorite IDE—becomes impossible with complex cloud-based services that can’t run on your laptop.
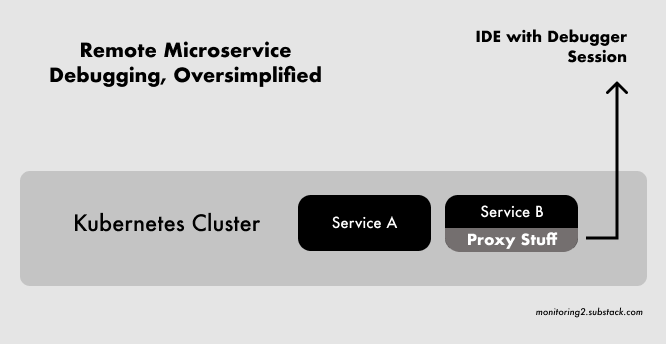
Two open-source projects, Squash (created by solo.io) and Telepresence (created by Datawire), use special proxies that hook into remote clusters to enable debugging with the usual tools and IDEs. It’s a developer-specific workflow complimentary to monitoring, where, in the words of Squash’s documentation, the feedback loop might be too slow:
Certain tools exist for troubleshooting microservice issues. OpenTracing can be used to produce transaction or workflow logs for post-mortem analysis. Service meshes like Istio can be used to monitor the network to identify latency problems. Unfortunately, these tools are passive, the feedback loop is slow, and they do not allow you to monitor and alter the application during run time.
There are some clever networking tricks that make this kind of remote debugging possible, including a novel use of Envoy proxy to filter special debugging requests in Squash or various VPN tunneling and shared library hacks in Telepresence. Telepresence also has some additional features like live coding a service (that is hopefully not running in production).

If you blended some of the debugging use cases of Squash and Telepresence with a modern APM solution and cloud IDE, you might get something like Rookout (previously mentioned in the Kubecon 2019 recap).
The ‘Responsive Code-Data Layer’ with Rookout
As Squash’s about page says, most monitoring solutions are passive: if you need new information, you must deploy a change (code, agents, plugins, config files, or libraries) and get back additional telemetry. There are some emerging techniques to instrument code (eBPF, covered previously), but gathering new data generally requires a new deployment.
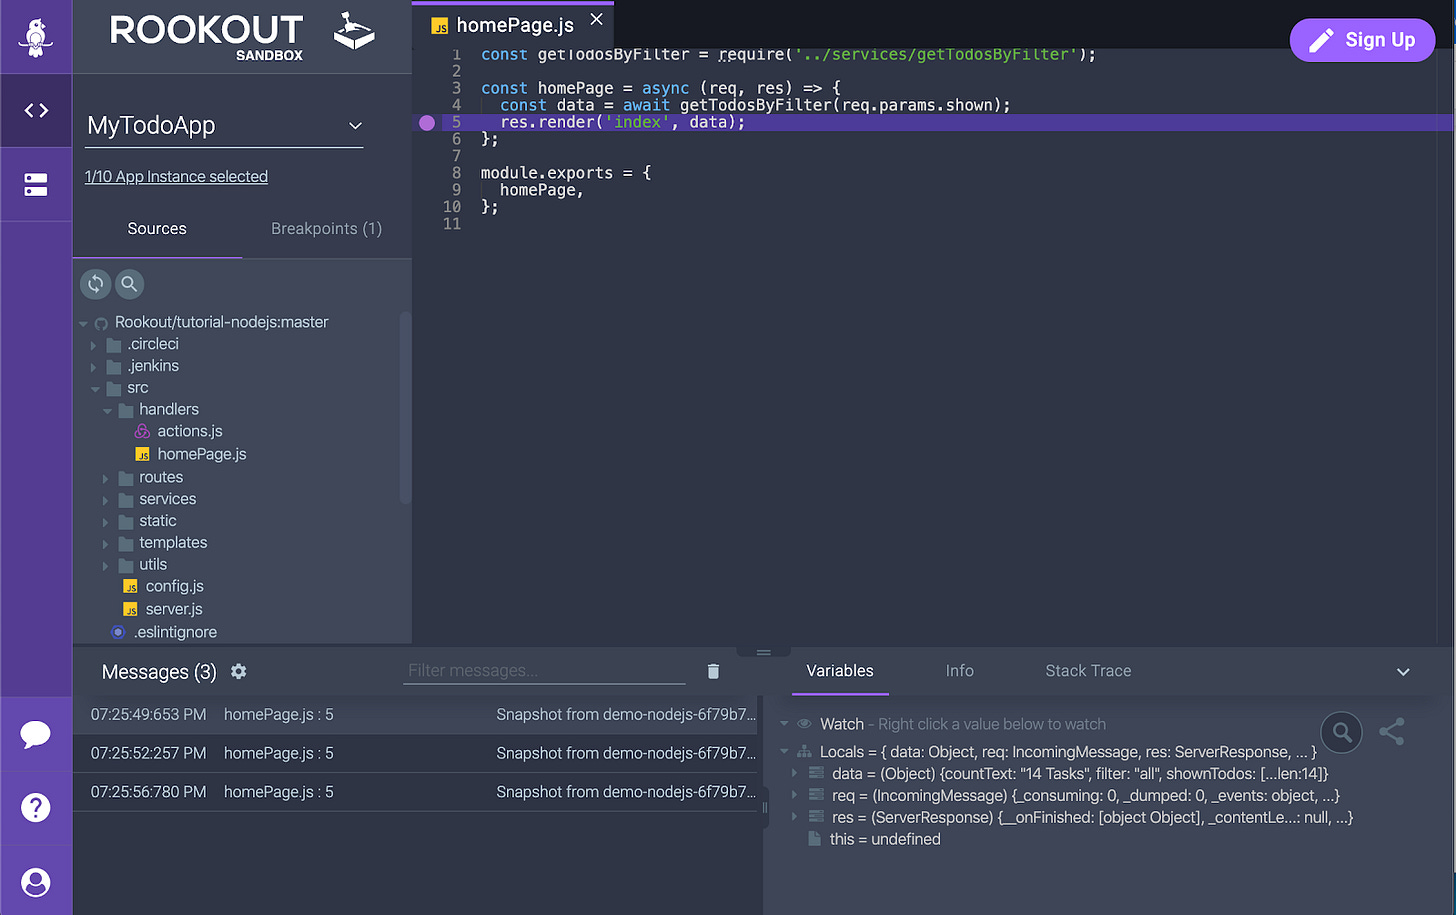
Rookout offers an alternative without requiring a deploy to get new logs or metrics: if you want to measure something new, just click a line of your code in their cloud-based user interface. They call it the “responsive code-data layer” on their marketing page.
There is an interactive sandbox available for testing, but visually the idea is clear to developers—it’s an IDE-like environment where you set breakpoints to collect new data and control observability in real-time:

This kind of product opens up several new use cases. One of my favorites is called “sustainable logging”, where you can reduce the volume of your log messages (i.e. Splunk bill).
If you combine observability, an IDE, a new programming language, workflow, and managed infrastructure, we might end up with Dark, a new backend-as-a-service startup.
Trace-Driven Development with Dark
The most compelling phrase in Dark's private beta documentation might be trace driven development: you “send requests to Dark before writing code.” Trace-driven development isn’t a new idea but hasn’t seemed to break into the mainstream, either. (Ted Young of Lightstephad a great talk on it in 2018.)
Ted’s talk and an obscure Erlang message board post from 2012 echo an idea that Dark seems to be exploring in their product: how can traces result in a faster development and testing feedback loop and higher quality, working software? In Dark, a developer is constantly using traces that start with end-user requests to develop and integrate code.
Consider the example below, which is a screenshot of a simple app in the Dark IDE (named “the canvas”). Traces are the clickable dots to the left of the HTTP handler and each end-user request is represented by a different dot that can be selected and replayed:

Want to change the code to handle a new kind of query parameter named “foo”? First, make a HTTP request that contains that new parameter and then start coding to handle it. As you type, everything automatically updates without a deploy.
Dark seems to be the first kind of a development environment that puts end-user traces front-and-center. It also pretty much explodes every other convention around backend service development.
Code-centric Monitoring
Despite the perception that monitoring solutions are only used by developers when something goes wrong (see last issue), there has always been a slow feedback loop from understanding collected telemetry to code changes. These projects and companies offer different solutions designed around tracing code execution to improve this:
Connect local debugging workflows and tools to distributed systems (Squash, Telepresence)
Integrate an IDE-like breakpoint experience with an observability solution (Rookout)
Redefine the entire backend development workflow and toolchain (Dark)
All of the above also suggest a more code-centric and active approach to monitoring—the central user interface is interacting with your own code, not a dashboard or query interface. For backend developers, new approaches that offer relief from the status quo seem welcome.
Thanks for reading. If you enjoyed this newsletter, feel free to share using the link below or subscribe here.
Disclosure: Opinions my own. I am not employed, consulting, or an investor in any of the mentioned companies or their competitors.
