eBPF: A new BFF for Observability Startups
The newsletter this week continues looking at interesting products monitoring startups are building. After a shallow dive into observability pipelines, let’s consider eBPF: the most technical and nerdy topic in the entire monitoring space right now.
eBPF, short for extended Berkeley Packet Filters, is a Linux subsystem that has seen significant adoption in systems performance engineering and software-defined networking tools. Netflix’s Brendan Gregg, who just published a book about eBPF, has called it a “Linux superpower”.
For a small number of startups with very technical founders, eBPF is being used for flow monitoring, a type of network traffic analysis. Network data collected using eBPF, particularly when combined with metadata from Kubernetes or service meshes, opens up some interesting use cases and hints at bigger things to come—maybe.
eBPF vs Traditional Instrumentation
If you’re not a Linux kernel hacker, there’s something fundamental about eBPF you should understand, and that’s related to how eBPF collects observability data.
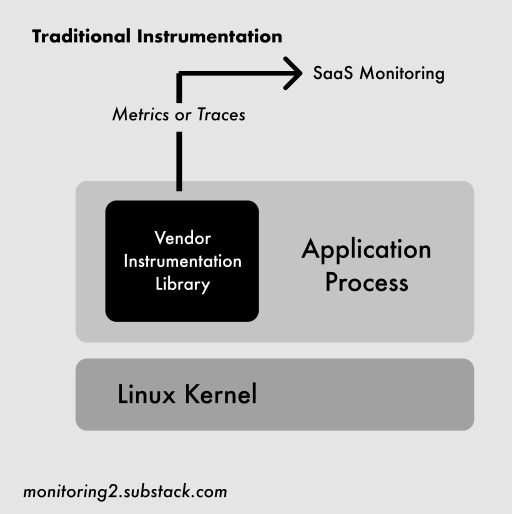
If you were going to build some kind of application monitoring solution in the past two decades, the general approach has been to write a special-sauce library (“a monitoring agent”) that runs alongside your code and instruments different events to generate metrics. It’s hard to do because of a massive number of edge cases (see here), but at a high level looks something like this:

The eBPF approach is fundamentally different: Linux engineers write programs that run safely inside the kernel to hook into and measure nearly any kind of system event. Networking-related events, like connections opening or closing, are especially well-supported. Highly (highly!) simplified, it looks like this:

With eBPF, interesting things that happen in code or in the kernel that you want to measure—like how many connections are made to an IP address—can now be captured at a lower level without special application libraries or code changes. If well-written, eBPF programs are also very performant. Facebook, apparently, now has around 40 eBPF programs running on every server.
As of late 2019, six to seven startups seem to be using eBPF for some kind of observability offering (and discussing it publicly): Flowmill, Sysdig, Weaveworks’ Weave Scope, ntop’s ntopng, Cillium’s Hubble, Datadog and Instana*. There is also an open-source Prometheus exporter from Cloudflare.
The main thing all the paid products have in common is they seem to be good at building detailed network flow maps and capturing related metrics:

Since eBPF works on any new-ish kernel version, there is also a possibility of building a more complete map of the things that do things in your cloud/datacenter, not just the latest stuff you have running in Kubernetes or services that you hand-instrumented in Rust.
Flowmill’s CEO Jonathan Perry described three broad use cases for this kind of monitoring during a recent talk:
Software architecture (how everything fits together with neat visualizations)
Service health (figuring out what’s not working via networking metrics)
Data transfer cost optimization (see Corey Quinn’s tweet on why this is so painful in the cloud)
It’s a solid list and expands on well-known eBPF security and performance tuning use-cases.
What’s next?
All of the work done in eBPF so far opens up an interesting question: eventually, will it replace most forms of agent-based instrumentation with magic bytecode that runs in the kernel and understands everything your system, applications, network and services are doing at an extremely low level that results in amazing visualizations and operational insights at hyper-cloud scale?
Not yet. But people are probably working on it. To nerd out on how it might happen, take a look at user-level dynamic tracing (uprobes) or user statically-defined tracing (USDT). Both are methods to hook into application-level events. There are some really interesting blog posts and examples and cool proof-of-concept code, like a BPF program that spies on everything you type into the shell.
There’s still a lot of superhero-level systems engineering that needs to be done. Until someone figures that out, eBPF solutions are exciting to watch for security use cases and network or flow monitoring—especially if you’re experimenting with service meshes or running lots of clusters.
That’s it for this newsletter. If you enjoyed reading, feel free to share using the link below or subscribe.
*Correction: The email edition of this newsletter left out Instana and Datadog. Instana seems to be using some eBPF functionality in technical preview according to their docs and Datadog is using a fork of Weaveworks’ TCP tracer and is using it their month-old Network monitoring solution.
Newsletter disclosure: Opinions my own. I am not employed, consulting, or an investor in any of the mentioned companies or their competitors.
Appendix: Deep Dives on eBPF Monitoring from different startup perspectives
